| Automated Business Solutions On The Web! |
| Home | Features | Solutions | Industries | About Us |
| Feature Spotlight |
| Charts And Graphs | ||
| Overview | ||
| If you have the need to add presentation ready graphs and charts to your reports, ScribeBase has you covered. Using the built-in Chart Wizard you can create a chart or graph in seconds. Whether you are trying to show the Number of Widgets Produced by Month or your Top 20 Customers Based on Revenue, we have a chart for you. There's a huge combination of features and options that can be used to create you charts and graphs. The examples below are just the tip of the iceberg. |
||
| 2 Dimensional Example | ||
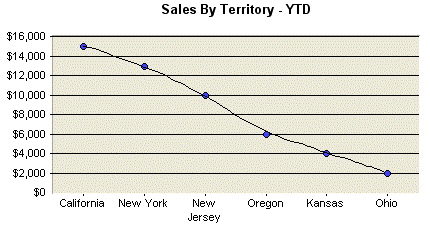
| Line Graph | ||
| ScribeBase can create both 2 and 3 dimensional charts. The following is an example of a simple two dimensional Line Graph. | ||
 |
||
| 3 Dimensional Examples | ||
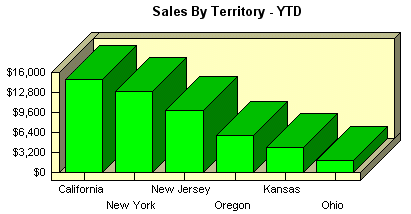
| Bar Graph | ||
| The following is an example of a 3D Bar Graph. | ||
 |
||
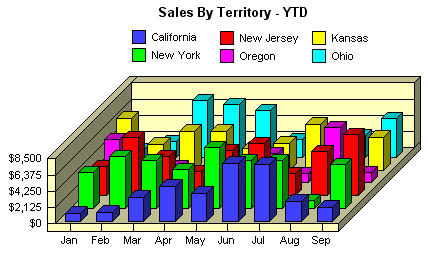
| Bar Graph - Comparison | ||
| The following is an example of a 3D Bar Graph that compares 6 different series of data. | ||
 |
||
| Bar Graph - Horizontal | ||
| You can even lay the Bar Graphs on their side. | ||
 |
||
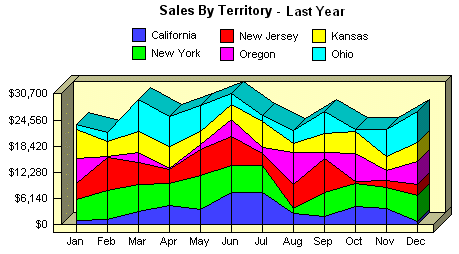
| Area Graph - Stacked | ||
| You can create Area Graphs which enable you to compare individual numbers and totals all on one graph. | ||
 |
||
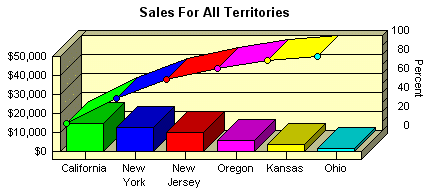
| Pareto Chart | ||
| The Pareto Chart is really two charts in one. The bars show the numbers for a specific item, and the line shows the percent of total for the entire chart. In this example, the bars show the sales for each Territory and the line shows that the first 3 Territories contribute about 75% of the sales. | ||
 |
||
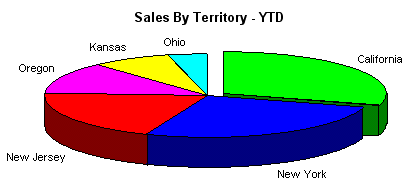
| Pie Chart | ||
| Pie charts can even look 3D! | ||
 |
||
| Copyright © 2000-2019 ScribeBase, Inc. All rights reserved. |